TL;DR
아주 기초이므로 Skip하시고, 다음 글 Atlas Chart Demo with Lookup(Join)만 보셔도 됩니다.
Table of Contents
1. Atlas Chart Demo
1-1 Chart > Add Dashboard
1-2 Add Chart > Select Data Source
1-3 Select Fields and Chart Type > Save and close
1-4 Add Chart > Select Fields and Chart Type > Save and close
1-5 … Click > Embedded 선택
1. Atlas Chart Demo
1-1 Chart > Add Dashboard

1-2 Add Chart > Select Data Source
sample_mflix의 users collection을 선택

1-3 Select Fields and Chart Type > Save and close
[상단의 Natural Language가 아닌 Classic 선택]
Total Number of Users를 Count해서 숫자로 보여 주는 차트 생성

1-4 Add Chart > Select Fields and Chart Type > Save and close
Comments를 등록한 Top 10 User를 보여 주는 Bar Chart 생성

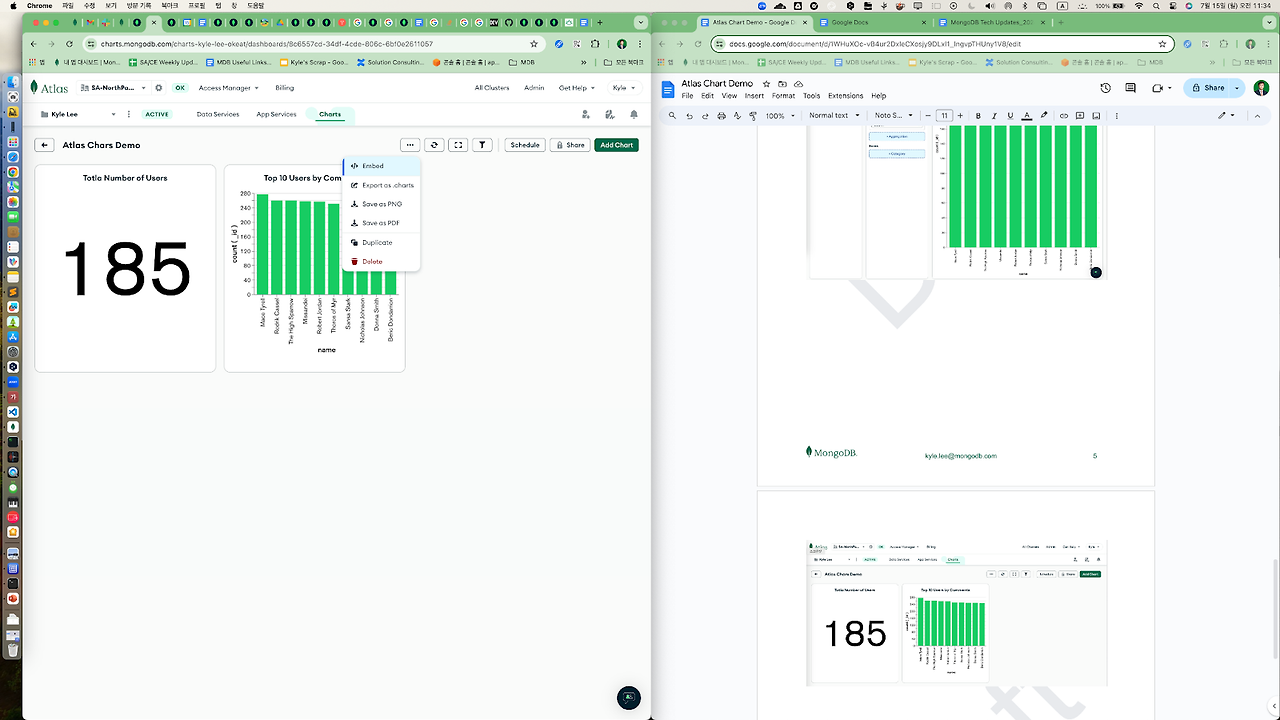
1-5 … Click > Embedded 선택
Dashboard를 iframe tag로 Export

'T. > MongoDB' 카테고리의 다른 글
| [Performance]readPreference Test (2) | 2024.07.24 |
|---|---|
| Atlas Chart Demo w/ Lookup(Join) (0) | 2024.07.22 |
| [Backup & Recovery]DB 복구, 그 아찔한 기억(Table Level Recovery) (0) | 2024.06.06 |
| [Performance]Dump and Restore (0) | 2024.06.06 |
| [Performance]MongoDB Atlas Tier and Sharding (1) | 2024.06.01 |


